

You are viewing an archived web page that is no longer maintained. View current CISN web pages
Details | Ground motions | Maps | Waveforms | Related links
|
|
||||||||||||
Nov 15: The Parkfield ShakeMap has been updated with recently recovered values of peak ground velocity from the CGS stations.
Oct 01: A close review of the Parkfield aftershock sequence has revealed some overestimated magnitudes for events occurring in the tail of larger earthquakes. In particular, the event immediately after the M6 mainshock is not a large as originally determined. The revised magnitude is M4.2. At this point in time, the M6 has two aftershocks of M5 - one on 9/29 at 17:10 UTC (10:10 AM PDT) and one on 9/30 at 18:54 UTC (11:54 AM PDT).
Sept 30: Another magnitude 5.0 earthquake shook the Parkfield area at 11:54 AM local time.
Sept 29: The Parkfield area experienced a sizeable aftershock today - an Mw 5.0 at 10:10 AM local time. This earthquake occurred toward the northern end the rupture zone in yesterday's M6. Also, an M5.0 earthquake occurred east of Bakersfield at 3:54 PM local time. The earthquake near Bakersfield did not occur on the San Andreas fault. Because of the timing and distance of this event with the 2004 Parkfield earthquake, there may be a correlation between the events.
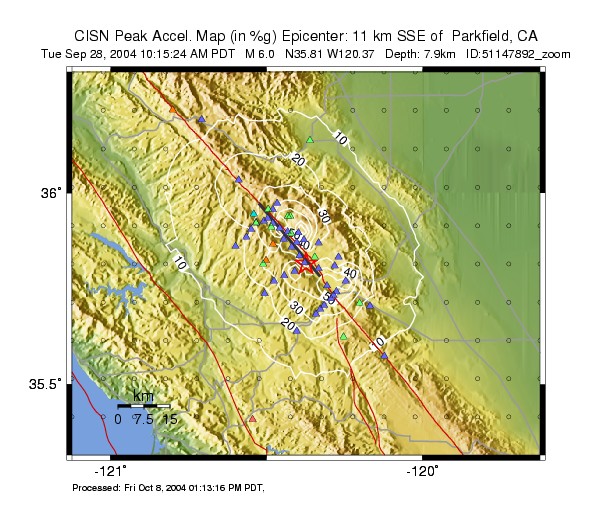
Sept 28: This earthquake is the anticipated Mw 6.0 on the San Andreas fault. It ruptured roughly the same segment of the fault that broke in 1966.
This earthquake occurred at 10:15 AM PDT on September 28, 2004 had a hypocenter of 35 degrees, 49 minutes north, 120 degrees 22 minutes west, and a depth of 8 km or 5 miles. From this point along the San Andreas fault, about 7 miles SW of the town of Parkfield, it ruptured primarily northwest along the fault. Strong shaking during this event lasted for about 10 seconds. Today's earthquake is the seventh in a series of repeating earthquakes on this stretch of the fault. The previous events were in 1857, 1881, 1901, 1922, 1934, and 1966. The previous two earthquakes ruptured the opposite direction from NW to SE along this section.
Just to the north of the rupture, the National Science Foundation's EarthScope Program, in partnership with USGS, is drilling a scientific borehole that will ultimately intersect the San Andreas fault at depth. Drilling operations ended a week ago at a depth of 8500 feet and a distance of 1500 feet from the fault.
The Parkfield area has been the focus of intensive research since the mid-1980s. Today's earthquake will provide us with a very detailed view of a large earthquake on the San Andreas fault and will provide scientists with new data on how such earthquakes occur and create damage.
The CISN Northern California Management Center produces ShakeMaps for events of M3.5 and higher. ShakeMaps are based on the observed ground motions from seismic instruments combined with predicted motions in areas without sensors. In this sequence ShakeMaps have been produced for several events.
The initial ShakeMaps did not have many direct observations. However, as data from the many strong-motion sites associated with the Parkfield Prediction Experiment have been processed, more values have been added. The most recent update was Nov 15th and included many recently recovered values of peak ground velocity from the CGS stations.
The CISN Engineering Data Center produces reports showing details of ground motions for events of interest. Although data are still being collected, the largest observed peak ground acceleration is 0.85G from a site located about 9 km southeast of the epicenter.
Many earthquakes in this swarm have been widely felt. People with Internet access can report their observations of shaking and damage through the Did You Feel It? Web site. In the links below, you can see the maps illustrating the reported intensities for several events in this sequence. Unlike the ShakeMaps - which are based on data from seismic instruments - these maps are based on human observations. You can contribute to these data by filling out the form for each event.
These links will take you to seismocams showing current earthquake activity.
Below are links to waveforms for the 6.0 Mw event.