
You are viewing an archived web page that is no longer maintained. View current CISN web pages
The initial ShakeMap for the Parkfield earthquake did not contain many direct observations as the number of digital stations with telecommunications are limited in this area. However, as data from the many strong-motion sites associated with the Parkfield Prediction Experiment have been processed, more values have been added.
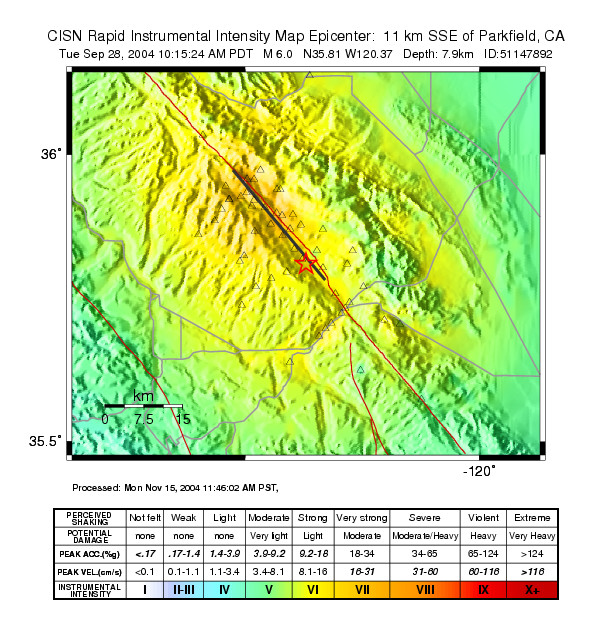
There have been two major updates in the weeks since the earthquake. The first, on October 8th, included nearly all the peak accelerations from the analog instrumentation operated by CGS and the USGS in the Parkield area. These values provided considerable detail to the maps of PGA. At that time, values of peak velocity had not yet been obtained from many of these stations. As a result, the map of instrumental intensity, which depends on both PGA and PGV, was not fully represented.
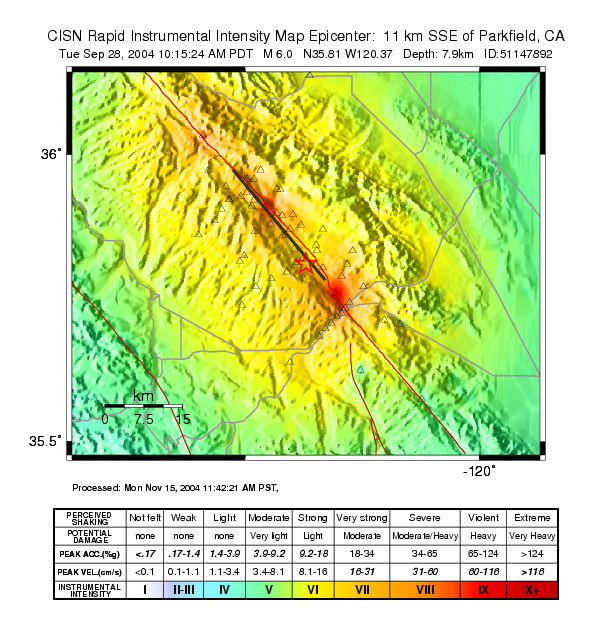
On November 15 the CISN provided another update of the ShakeMap. This map contains almost all of the peak peak accelerations and most of the peak velocities from the analog strong motion instruments maintained by CGS. Data from these 54 instruments, as well as 11 GEOS instruments maintained by USGS, had to be manually retrieved and processed; the peak accelerations were added to ShakeMap as they became available. The additional peak velocities, however, provide significant detail to the map of Instrumental Intensity. Three stations in particular (Fault Zone 1, Fault Zone 14, and Slack Canyon) have large peak velocities, while the stations near the epicenter at Gold Hill have relatively small peak velocities. This revised ShakeMap closely approximates the final ShakeMap that will incorporate all the near-field data.
This late update of the ShakeMap is extremely unusual. Because of the Parkfield Prediction Experiment, the Parkfield area was heavily instrumented in the mid-to-late 1980s. As a result, most of the strong motion data for the 9/28/04 earthquake were recorded on film, rather than with digital systems. Significant effort was required by CGS and USGS staff to retrieve and process the data, initially for PGA and more recently for PGV. The data set of strong-motion records is being compiled as a CISN Internet Quick Report.
A comparison of the October 10th and November 15th maps is below.