Map
of California & Nevada earthquakes
M4.2 near Alameda, CA
| Information from the CISN Northern California Management Center USGS & UC Berkeley |
|
| Date & Time (Local): | 2007/07/20 04:42:22 (PDT) |
| Date & Time (UTC): | 2007/07/20 11:42:22 (UTC) |
| Location: | 4 miles NE of Alameda, CA 37.804N 122.193W |
| Depth (km): | 5.3 |
| Magnitude: | 4.2 Mw |
- Details
-
The map below shows earthquakes along and near the Hayward Fault from 2000 to the present. The July 20, 2007 event is indicated in green, and black dots indicate background seismicity. Other recent clusters along and near the Hayward Fault are marked in color, with the earthquakes from December 2006 in yellow. The Lafayette event which occurred on the evening of March 1, 2007 and its aftershocks are denoted in dark blue.
The earthquake on the morning of July 20, 2007 occurred farther southeast along the Hayward Fault than the events in the sequence which occurred around Christmas, 2006. It was felt widely throughout the Bay Area and jolted many residents awake. Its mechanism is typical for strike-slip along the Hayward Fault. Although there have been many small events along the Hayward Fault over the past few years, in 1868 the Hayward Fault hosted the first good-sized earthquake to occur in the Bay Area in a relatively heavily populated Area. Here is more information on the 1868 Hayward Fault earthquake.

Bob Uhrhammer & Peggy Hellweg
- Ground Motions
-
The CISN Northern California Management Center produces ShakeMaps for events of M3.5 and higher. ShakeMaps are based on the observed ground motions from seismic instruments combined with predicted motions in areas without sensors.
The CISN Engineering Data Center produces reports showing details of ground motions for events of interest. They have issued an Internet Data Report for the M4.2 showing records from Oakland's Fire Station 16 (3.7 km away) as well as other sites of interest:
This earthquake was widely felt in the East Bay. People with Internet access can report their observations of shaking and damage through the Did You Feel It? Web site. Unlike the ShakeMaps - which are based on data from seismic instruments - these maps are based on human observations. You can contribute to these data by filling out the form for the event.
- Maps
-
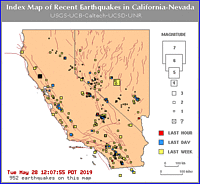
- RecentEQs quad for this event
- Bay Area seismicity Current (through last week)
- Current Activity
-
These links will take you to seismograms showing current earthquake activity.
- Related Links
-
- The Hayward Fault
-
Information on the Hayward fault, including maps, tours, seismicity, and current research.
- Bay Area and California Earthquake Probabilities (PDF)
-
Results from the USGS-led working group indicate that the San Francisco Bay Area has a 63% probability of experiencing an M6.7 or higher earthquake from 2003 to 2032.
- Earthquake Scenario ShakeMaps
-
The USGS has computed ShakeMaps for several scenario earthquakes on the
Hayward fault.
- M6.5 on the northern Hayward fault
- M6.7 on the southern Hayward fault
- M6.9 on the full Hayward fault
These maps illustrate the ground motions predicted for such events.
![]()
|
Berkeley Seismological Lab
|
|

Copyright 1995-2005, The Regents of the University of California.
Last modified: Wed Aug 8 13:21:40 PDT 2007