

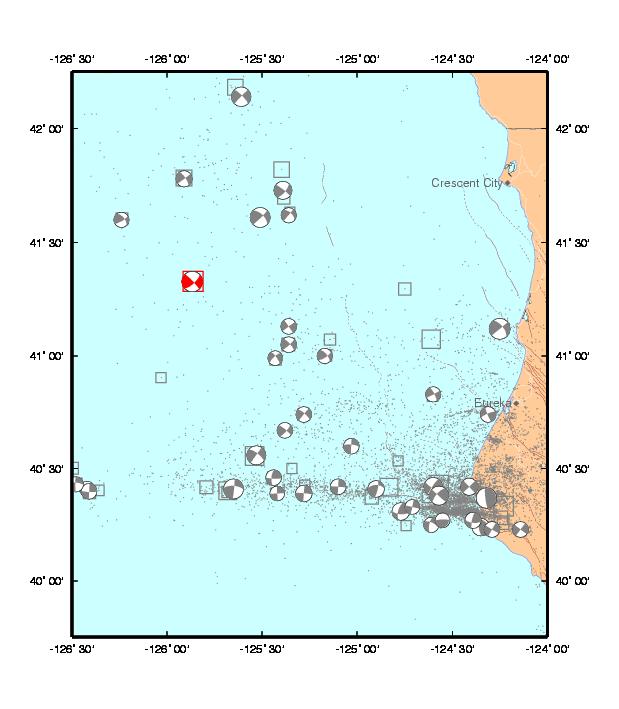
Seismicity from January 1, 1980 - June 15, 2005. Large earthquakes (M>=5) are plotted with open squares while smaller earthquakes are plotted as points. Havard Moment Tensor solutions for M>5 earthquakes are plotted as well. The 6/15/2005 M7.2 is plotted in red, previous earthquakes are plotted in grey.