

Overview
A magnitude 6.5 earthquake struck the central California coast on December 22, 2003 at 11:15:56 am (PST). The event was located 11 km NE of San Simeon, and 39 km WNW of Paso Robles, where the brunt of the damage and casualties occurred.
The focal mechanism of this event derived from first motion (http://www.cisn.org/special/evt.03.12.22/nc40148755.ncfm1-fig2.gif) and low-frequency waveforms recorded by the Berkeley Digital Seismic Network (Figure 1) indicate that this event was reverse, where adjacent blocks are thrust together one riding over the other. Such types of earthquakes are not uncommon in central California and are due to a small compressional component of the differential motion between the North American and Pacific plates. Other events of nearly the same size in central California, which have had this type of reverse motion include the 1983 Coalinga (M6.4), and 1985 Kettleman Hills (1985). In 1952 a M6.0 earthquake occurred in the same general area of the December 22, 2003 quake.
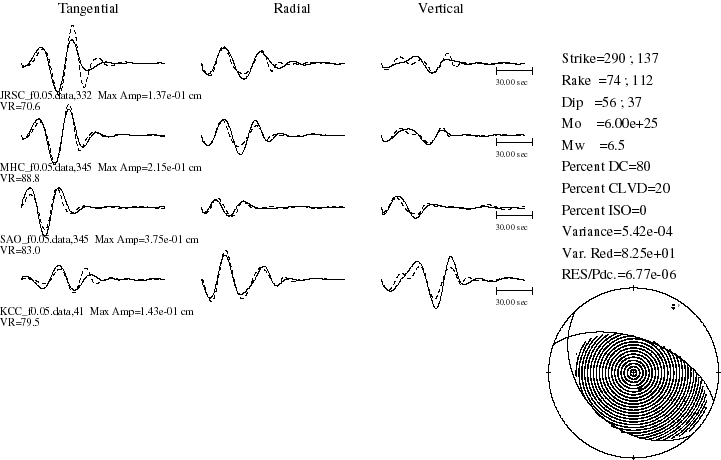
Figure 1. Berkeley Moment Tensor solution. Low-frequency, 3-component, complete seismograms were used to determine the seismic moment tensor. Solid lines show the observed waveforms, and dashed lines show the model predictions. A scalar seismic moment of 6.00*10**25 dyne cm corresponding to Mw6.5 was determined. The best fitting source depth of 8 km compares well with the depth determined from the NCSN.
Aftershock Seismicity
This continues to be an energetic sequence with hundreds of aftershocks with M>1.8. Currently there have been 16 aftershocks with magnitude greater than or equal to 4.0. The aftershock are located in a cloud predominantly to the SE of the epicenter. It is likely that these aftershocks define the rupture area of the mainshock.
Finite-Fault Analysis of the Mainshock
Broadband waveforms recorded by the Berkeley Digital Seismic Network were inverted to determine the finite fault parameters of the event. Although there is a slight preference for the NW striking plane (strike=290) the difference in the level of fit for the two planes is nearly the same. Line source calculations reveal that the earthquake ruptured primarily to the SE in the direction toward Paso Robles. The line source results were used to revise the ShakeMap (Figure 3). The revised ShakeMap, taking into account the source information, has elevated intensity in the vicinity of Paso Robles which is consistent with the level of damage there. Additional ShakeMap information can be obtained from
http://quake.wr.usgs.gov/research/strongmotion/effects/shake/40148755/intensity.html.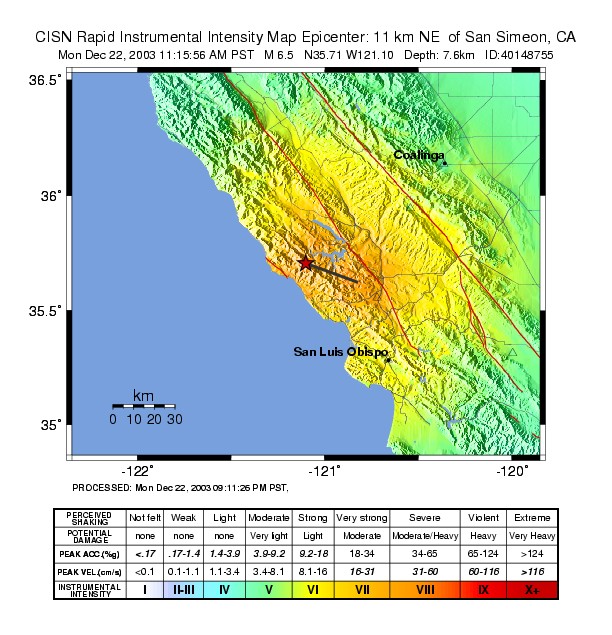
Figure 3. Instrumental Intensity Map. The line shows the extent of the fault determined from the line source inversion results.
We have also performed a planar finite-fault inversion. These results, which are preliminary are shown in Figures 4 and 5 and are consistent with the rapid line source results (Figure 3). Both fault models result in a similar distribution of slip extending to the SE. The fit obtained to the displacement waveform data is shown in Figure 6. With these data the NW striking plane (strike=290; Figure 5) fits the data slightly better, however it is not possible to resolve the fault plane from these stations. The fits are very good and the records are rich in low-frequency energy. In the coming days additional data will be added to improve the constraint on the finite-fault model to hopefully distinguish which of the two possible planes ruptured in the earthquake.
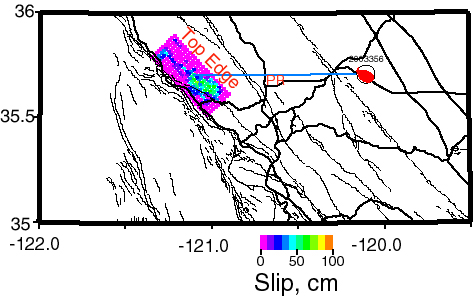
Figure 4. Map view projection of the slip obtained using the fault model defined by strike=137, dip=36, and rake=112. The blue line extending from the moment tensor points to the epicenter location. The top edge of the fault model and the location of Paso Robles (PR) are labeled. In this model the average slip, peak slip, faulting area, and stress drop of the main rupture patch are 29cm, 76cm, 460 km2, and 12 bars, respectively.
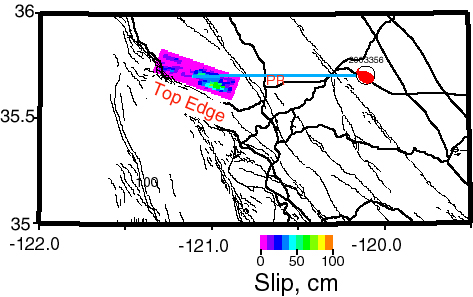
Figure 5. Map view projection of the slip obtained using the fault model defined by strike=137, dip=36, and rake=112. The blue line extending from the moment tensor points to the epicenter location. The top edge of the fault model and the location of Paso Robles (PR) are labeled. In this model the average slip, peak slip, faulting area, and stress drop of the main rupture patch are 25cm, 71cm, 512 km2, and 9.6 bars, respectively.
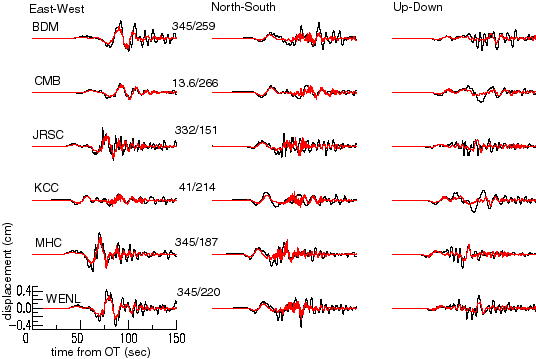
Figure 6. Three-component displacement data (black) and synthetics (red) are compared for six stations. All of the records are plotted on the same scale there is approximately 70 degrees of azimuthal coverage spanning NW to NE.
Ground Motion Simulation
Dr. Larsen of Lawrence Livermore National Laboratory (
www.llnl.gov/hmc) performed a numerical simulation of the San Simeon earthquake, which takes into account the Berkeley Moment Tensor solution, and the 3d velocity model developed by Berkeley for the greater San Francisco Bay Area (e.g. Stidham et al., 1999). The following link is to a mpeg movie of the simulation. http://www.seismo.berkeley.edu/~dreger/sansimeonmovie.mpgThe animation spans 210 seconds from the origin time. The blue and green colors indicate different sign of the waves (i.e. up vs. down), and the intensity of the color scales with amplitude. The wavefield incident to the San Francisco Bay Area is dominated by long-period surface waves which are then affected by the sedimentary basins increasing their amplitudes and locally extending the duration.