

You are viewing an archived web page that is no longer maintained. View current CISN web pages
This report was compiled on December 24, 2003, based on information from many scientists at the USGS, the Southern California Earthquake Center, U.C. Berkeley, Lawrence Livermore National Laboratory, and with the State of California.
A magnitude 6.5 earthquake struck the central California coast on December 22, 2003 at 11:15:56 am (PST). The event was located 11 km NE of San Simeon, and 39 km WNW of Paso Robles, where the brunt of the damage and casualties occurred. Two deaths have been confirmed due to a building collapse in Paso Robles. Preliminary reports suggest that the most severe damage was to unreinforced masonry structures that had not yet been retrofitted to better withstand earthquakes. Some unreinforced masonry structures that had been retrofitted survived the earthquake.
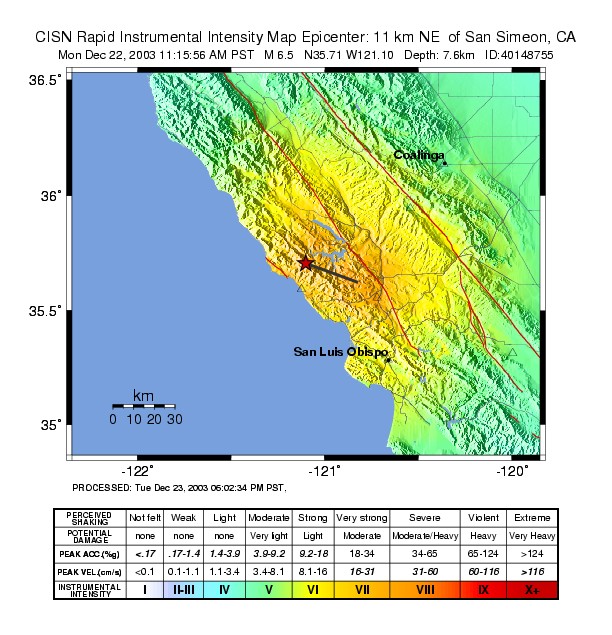
Damage reports and personal experiences during the mainshock are being compiled through the USGS “Did You Feel It” system and the results can be viewed online. The strong shaking during the mainshock reached 47% of the force of gravity at the Templeton Hospital grounds. The Templeton Hospital is off the southeast end of the rupture and may be representative of the highest ground motions in this earthquake because the rupture propagated from the hypocenter toward the southeast. However, there are few recordings from the immediate area around the mainshock which could have experienced similar or even higher shaking levels. Maps of estimated shaking and damage levels.
The shallow but powerful earthquake uplifted the Santa Lucia mountains and triggered a vigorous aftershock sequence. Approximately 800 aftershocks above magnitude (M) 1.8 and 97 above M3 have been recorded in the first 48 hours since the initial temblor, and they are expected to continue for several years. The rate of aftershocks is about 50% higher than the average California earthquake sequence bit.
Numerous active faults are mapped in the epicentral region (Figure 1) , but it is not yet clear which, if any, of these mapped faults may have ruptured during the quake. No surface rupture from the earthquake has yet been identified. Road buckling and reported surface breaks all appear to be secondary deformation due to the earthquake, not surface rupture of the main fault. Many landslides and liquefaction features have been found as is typical for an earthquake of this size.
The San Simeon earthquake was a reverse event, where adjacent blocks are thrust together, one riding over the other. Such types of earthquakes are not uncommon in central California and are due to a small compressional component of the differential motion between the North American and Pacific plates. Other events of nearly the same size in central California, which have had this type of reverse motion, include the 1983 Coalinga (M6.4), and 1985 Kettleman Hills (M5.9) earthquakes. In 1952, a M6.0 earthquake occurred in the same general area of the December 22, 2003 quake.
Scientists seeking to better understand this earthquake, its effects, and the hazards posed by similar future events are currently in the field installing additional seismic and geodetic stations in order to extract more information from the aftershock sequence and post-mainshock deformation, are doing field surveys to determine the if there was any surface faulting and to determine the distribution ground failures due to landslides and liquefaction, and to determine the distribution and causes of damage to buildings and infrastructure.
The event hypocenter coordinates are 35.706N, 121.102W and the depth is 7.6km.
The focal mechanism of the San Simeon mainshock was derived both from P-wave first motion polarities recorded by the Northern California Seismic Network (Figure 2) and low-frequency waveforms recorded by the Berkeley Digital Seismic Network (Figure 3). Both mechanisms are similar in that they are nearly pure thrust motion on a fault striking ESE-WNW. The two possible fault planes dip NE and SW, and the NE-dipping plane dips slightly more steeply. Based on the distribution of aftershocks and finite fault models (see later in this report) we currently expect that the NE dipping plane is the mainshock fault plane and that it slipped up to about 50 cm during the mainshock. The mainshock rupture may have been a simple planar fault, as the initial motion (Figure 2) and the major moment release (Figure 3) have very similar geometry. However, the orientation of these solutions does not match the aftershock distribution very well so the fault may have some curvature.
Approximately 600 aftershocks above M1.8, and 80 above M3 have been recorded in the first 24 hours since the mainshock. Based on the aftershocks during this time period, the rate of aftershocks for this sequence has been slightly higher than average for California; the productivity parameter a of the Reasenberg & Jones model of aftershock rate: r(t)=(10^(a+b(Mm-Mc)))/((t+c)^p) , is -1.59, compared to typical values of -1.76. The b value (0.88) and the decay parameter p (1.15) are typical. There is a 2/3 probability of a M5 aftershock in the next week, and a 1/8 probability of a M6 aftershock.
Double-difference relocations of a subset of the aftershocks show a cloud of events, predominantly to the SE of the epicenter (Figure 4: map | cross-section). The aftershock region extends approximately 30 km in length, and the width of the surface projection of the aftershocks is as large as 10 km. The depth of the aftershocks, and local pre-mainshock seismicity, rarely exceeds 8km. Although the aftershock sequence does not define a clear mainshock fault plane, a linear feature seen in cross-section suggests a very steep, northeast dipping plane.
Triggered seismicity has been observed in the Geysers region north of San Francisco. This region often produces triggered earthquakes after large events in California.
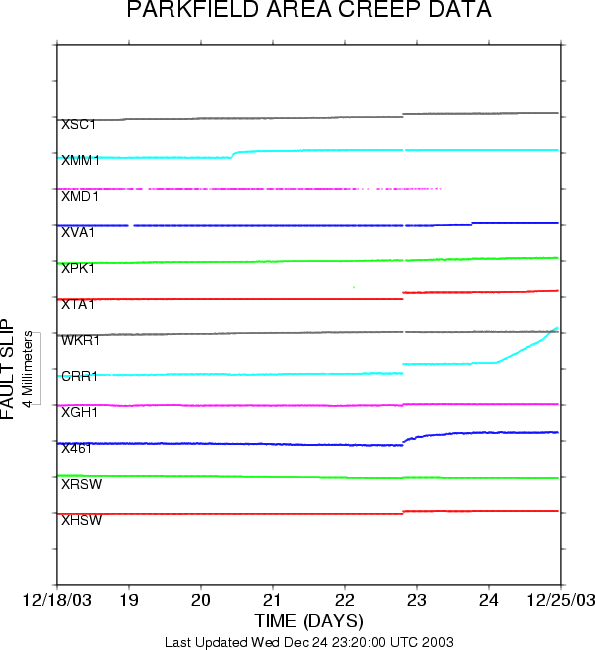
The San Simeon mainshock also triggered a small amount of right-lateral creep on the San Andreas Fault near Parkfield (Figure 5). At most creepmeters, this creep occurred as a step of <1mm at the time of the mainshock, although at station X461 the creep continued at a diminishing rate for about 24 hours. More than 24 hours after the mainshock, very rapid (~2 mm/day) creep started at CRR1, and still continues. The creep may have been triggered by the passing seismic waves, or from permanent stress changes. Modeling of the stress changes shows a small (about a twentieth of a bar) stress change on the San Andreas, encouraging right-lateral slip (Figure 6).
Broadband waveforms recorded by the Berkeley Digital Seismic Network were inverted to determine the finite fault parameters of the event. Line source calculations reveal that the earthquake ruptured primarily to the SE in the direction toward Paso Robles. A SE direction of rupture is consistent with the locations of the aftershocks. A preliminary planar finite-fault inversion is consistent with the line source results (Figure 7). Both fault models result in a similar distribution of slip extending to the SE. The fit obtained to the displacement waveform data is shown in Figure 8. With these data the NE-dipping plane fits the data slightly better, however it is not possible to resolve the fault plane from these stations. The fits are very good and the records are rich in low-frequency energy. In the coming days additional data will be added to improve the constraint on the finite-fault model to hopefully distinguish which of the two possible planes ruptured in the earthquake.
The line source results were used to revise the ShakeMap (Figure 9). The revised ShakeMap, taking into account the source information, has elevated intensity in the vicinity of Paso Robles which is consistent with the level of damage there.
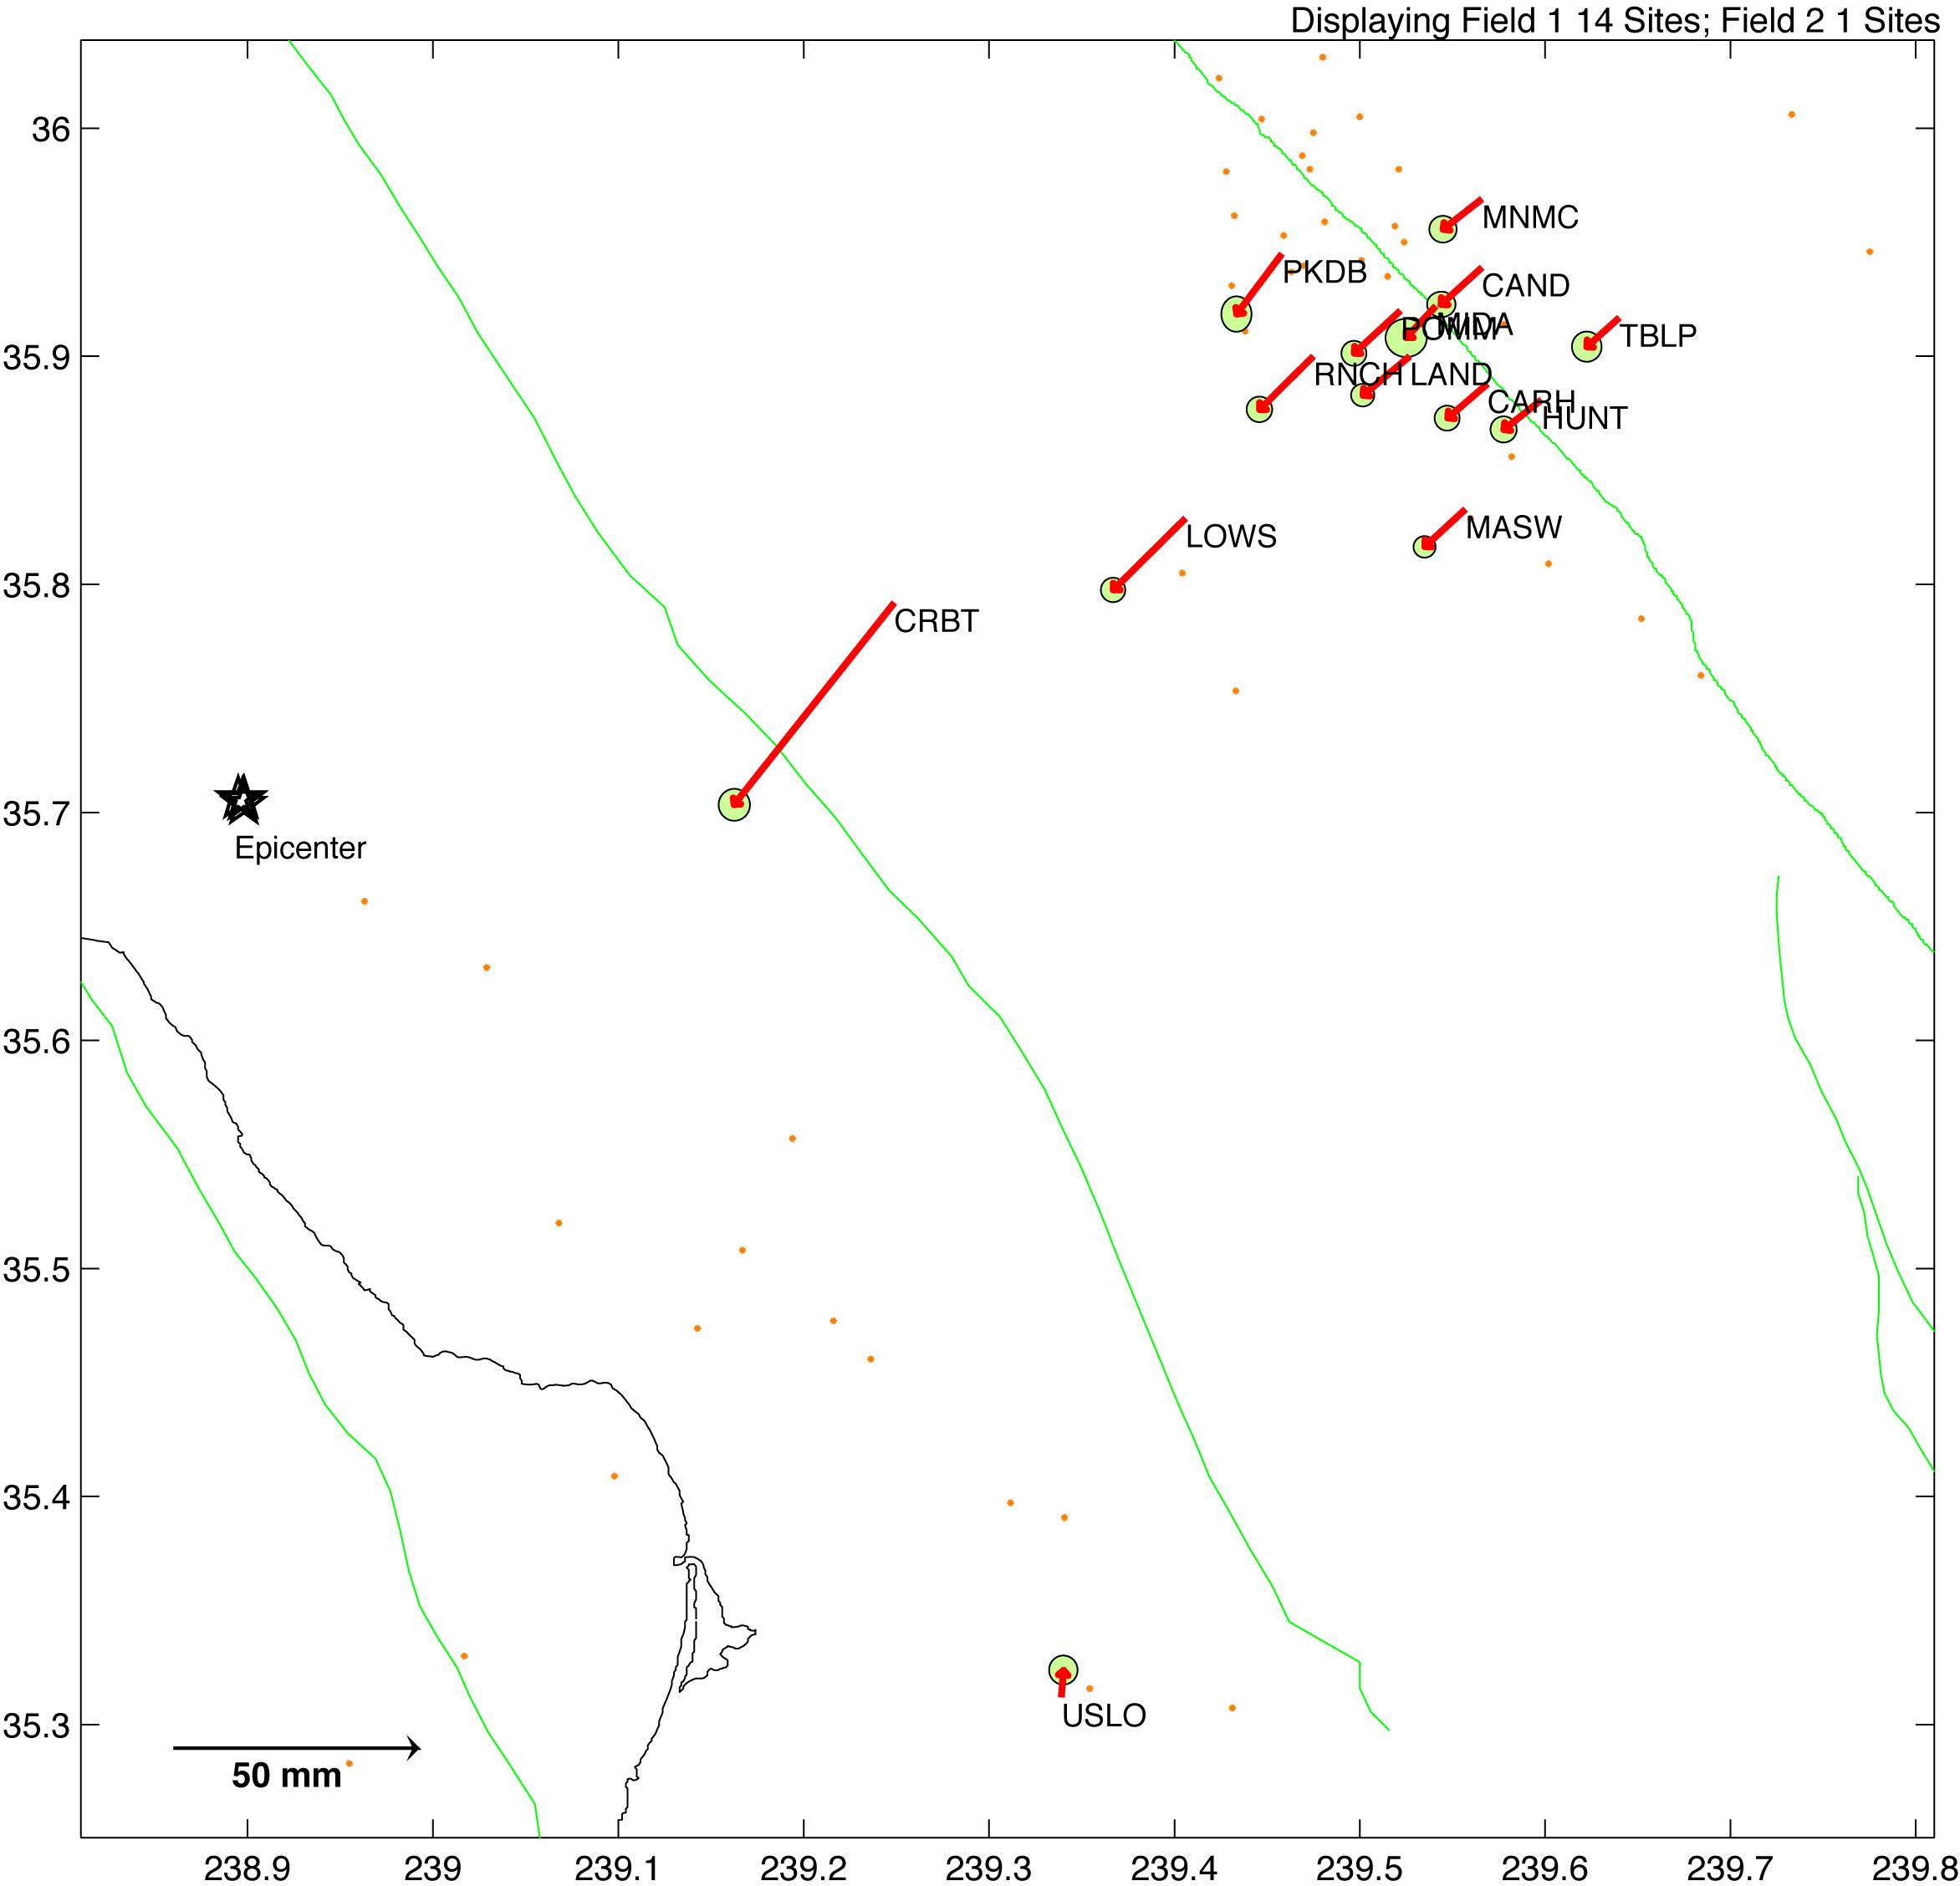
GPS data from the Southern California Integrated GPS Network (SCIGN) have been analyzed to obtain measurements of the static displacement field associated with the earthquake. Initial results were reported by Keith Stark, SCIGN Network Coordinator, on Tues., 12/23/03 including an approx. 50 mm southwestward displacement of the SCIGN station at Camp Roberts. Soon after this, Prof. Tom Herring of MIT, Chairman of SCIGN, provided preliminary displacement estimates for 14 SCIGN stations in the vicinity. A second iteration on these results is shown in Figure 10. Telemetry is down now, but once restored, re-estimates of site displacements will be performed taking into account all available data since the event.
As results are updated, they will be posted at http://www.scign.org/
Dr. Larsen of Lawrence Livermore National Laboratory performed a numerical simulation of the San Simeon earthquake, which takes into account the Berkeley Moment Tensor solution, and the 3d velocity model developed by Berkeley for the greater San Francisco Bay Area (view an mpeg movie of the simulation). The animation spans 210 seconds from the origin time. The blue and green colors indicate different sign of the waves (i.e. up vs. down), and the intensity of the color scales with amplitude. The wavefield incident to the San Francisco Bay Area is dominated by long-period surface waves which are then affected by the sedimentary basins increasing their amplitudes and locally extending the duration.
Figure 1. Map of San Simeon region.
Figure 2. P-wave first motion focal mechanism, determined using FPFIT by the NCSN. 122 P-wave polarities were used. The circles represent downward first motions, and the crosses represent upward first motion. The uncertainty in strike, dip, and rake is 5°, 3°, and 10°.
Figure 3. Berkeley Moment Tensor solution. Low-frequency, 3-component, complete seismograms were used to determine the seismic moment tensor. Solid lines show the observed waveforms, and dashed lines show the model predictions. A scalar seismic moment of 6.00*10**25 dyne cm corresponding to Mw6.5 was determined. The best fitting source depth of 8 km compares well with the depth determined from the NCSN.
Figure 4: map | cross-section. Double-difference locations for earthquakes in the region of the San Simeon earthquake. Phase picks from the NCSN were used to relocate the mainshock, ~500 aftershocks (red), and ~500 events (green) occurring between 1/1/1980 and just prior to the San Simeon mainshock.
Figure 5. Creep across the San Andreas fault at Parkfield, measured over the last 7 days.
Figure 6. Stress modeling plot of Coulomb Stress transferred onto faults oriented similar to the San Andreas fault by the San Simeon mainshock using a frictional coefficient of 0.4.
Figure 7. Map view projection of the slip using the fault model defined by strike=137, dip=36, and rake=112 (top); and strike=290, dip=74, and rake=56 (bottom). The blue line extending from the moment tensor points to the epicenter location. The top edge of the fault model and the location of Paso Robles (PR) are labeled. The average slip, peak slip, faulting area, and stress drop of the main rupture patch are 29cm, 76cm, 460 km 2 , and 12 bars, respectively (top) or 25cm, 71cm, 512 km 2 , and 9.6 bars (bottom.)
Figure 8. Three-component displacement data (black) and synthetics (red) are compared for six stations. All of the records are plotted on the same scale there is approximately 70 degrees of azimuthal coverage spanning NW to NE.
Figure 9. Instrumental Intensity Map. The line shows the extent of the fault determined from the line source inversion results.