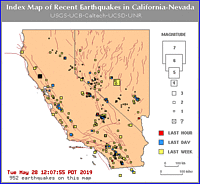
Map
of California & Nevada earthquakes
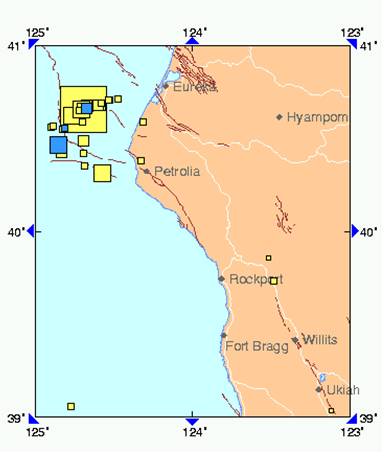
M6.5 Gorda Plate Earthquake
Offshore of Northern California
16:27 PST January 9, 2010
00:27 UTC January 10, 2010
| Information from the CISN Northern California Management Center USGS & UC Berkeley |
|
| Date & Time (Local): | 01/09/2010 16:27:39 (PST) |
| Date & Time (UTC): | 01/10/2010 00:27:39 (UTC) |
| Location: | 23 miles WNW of Ferndale, CA 40.652N 124.692W |
| Depth (km): | 29.3 |
| Magnitude: | 6.5 Mw |
- Details
-
Mw 6.5 earthquake occurred at 16:27 PST off the coast of Northern California, approximately 35 km WNW of Ferndale, CA. The hypocenter was located at a depth of 22 km, but accuracy is relatively poor owing to the earthquake occurring about 40 km offshore and 56 km from the nearest seismic station. This event was felt strongly in the nearby coast regions and caused damage in and to several buildings. The epicenter was at 40.645N,124.763W. The earthquake occurred in a deformation zone of the southernmost Juan de Fuca plate commonly called the Gorda plate. The earthquake's epicenter is northwest of the Mendocino Triple Junction, which is formed by the intersection of the Mendocino fracture zone, the San Andreas Fault and the Cascadia subduction zone. This is the largest quake to occur in this region since the April 4, 1992 magnitude-7.2 Petrolia and the June 15, 2005 magnitude-7.2 Gorda plate earthquakes. This event did not produce a tsunami. Strike-slip earthquakes are generally unlikely to produce large tsunamis because they cause relatively little vertical ground displacement.
Mainshock and Aftershock Seismicity
- Faulting mechanism
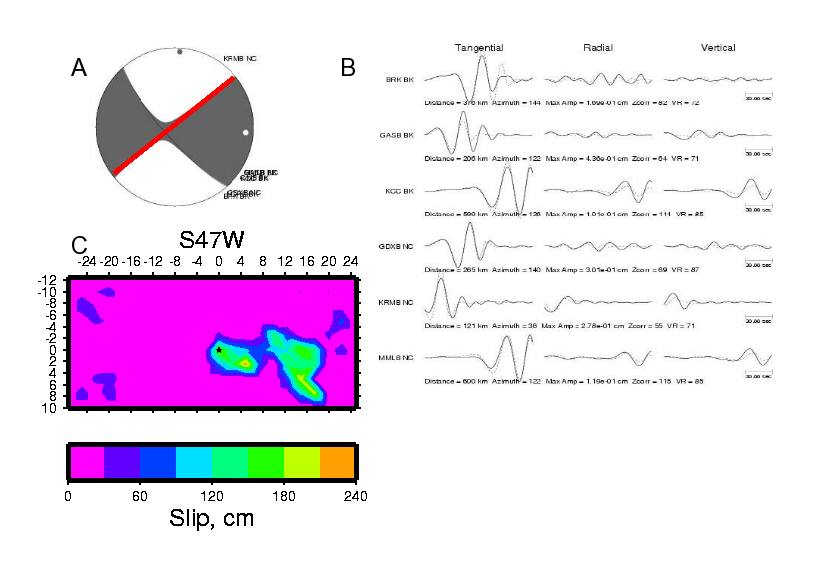
(A) UCB Moment tensor mechanism. (B) Waveform fits from this mechanism. (C) Best fit finite rupture model.
The mechanism of the earthquake indicates that slip occurred on a near-vertical, left-lateral fault. Berkeley Seismological Laboratory's automatically-running, finite fault inversion, completed within 20 minutes shows that the rupturing fault is oriented about NE-SW (red line). Large strike-slip earthquakes like this one are common in the interior of the Gorda plate. This rupture extended about 25 km unilaterally from the hypocenter to the southwest. The peak estimated slip was about 2 meters.
- Ground Motions
-

ShakeMap for the 10 January 2010 Gorda Event
The CISN Northern California Management Center produces ShakeMaps for events of M3.5 and higher. ShakeMaps are based on the observed ground motions from seismic instruments combined with predicted motions in areas without sensors. Shaking intensity onshore reached MMI VII-VIII. More ShakeMap related information for this event.
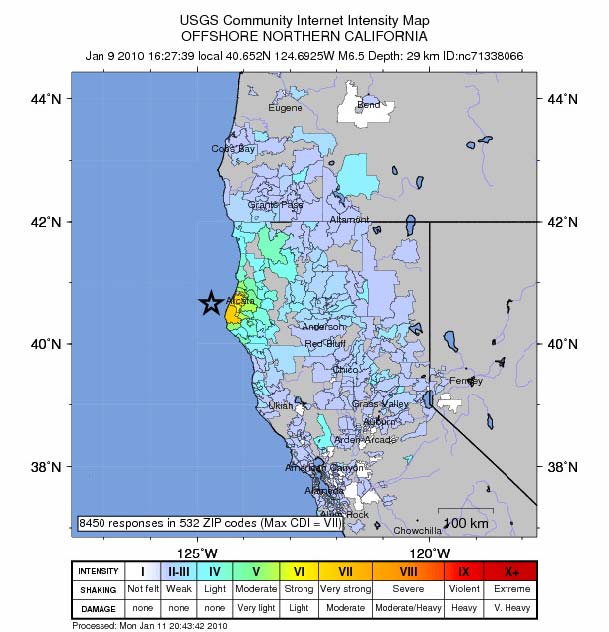
Community Internet Intensity Map for the 10 January 2010 Gorda Event
This earthquake was felt throughout Northern California. Shaking was strongest near the coast line between Petrolia and Eureka, CA, although felt reports for this event extend from as far south and north as Capitola, CA and Eugene, OR, respectively, and as far east as Reno, NV. USGS has received 8355 "Did You Feel It?" reports from 529 zip codes. The maximum recorded shaking was observed in Eureka (33%g), which is sufficient to cause moderate damage. People with Internet access can report their observations of shaking and damage through the Did You Feel It? Web site. Unlike the ShakeMaps - which are based on data from seismic instruments - these maps are based on human observations. You can contribute to these data by filling out the form for the event.
The probability of a strong and possibly damaging aftershock (M>5) in the immediate 7 days following the earthquake was approximately 78%. Twenty fours later, that probability diminished to 60%. Most likely, the mainshock will be the largest in the sequence. However, there is a small chance (~5-10%) of an earthquake equal to or larger than this mainshock in the next 7 days. In addition, numerous M3-5 aftershocks are expected to occur in the same 7-day period, but most are unlikely to be felt due to the distance from land. In the first 24 hours, there have been 23 aftershocks, the largest of which had a magnitude of 4.4. The Did-You-Feel-It reports indicate that earthquakes larger than M3 are being felt by nearby residents. <\p>
- Maps
-
- RecentEQs quad for this event
- Bay Area seismicity Current
- Current Activity
-
These links will take you to seismograms showing current earthquake activity.
- Related Links
-
- The Hayward Fault
-
Information on the Hayward fault, including maps, tours, seismicity, and current research.
- Earthquake Probabilities for the San Francisco Bay Area (PDF)
-
Results from the USGS-led working group indicate that the San Francisco Bay Area has a 63% probability of experiencing an M6.7 or higher earthquake from 2003 to 2032.
- Earthquake Scenario ShakeMaps
-
The USGS has computed ShakeMaps for several scenario earthquakes on the
Hayward fault.
- M6.5 on the northern Hayward fault
- M6.7 on the southern Hayward fault
- M6.9 on the full Hayward fault
These maps illustrate the ground motions predicted for such events.
![]()
|
Berkeley Seismological Lab
|
|

Copyright 1995-2008, The Regents of the University of California.
Last modified: Tues Sept. 9, 2008