

We have revised our earlier line-source model by considering a planar fault and adding additional near-fault CISN seismic recordings and GPS deformation data from the USGS Pasadena. The seismic waveform data was integrated to ground displacement and bandpass filtered between 0.01 to 1.0 Hz with an acausal Butterworth filter. Seismic Green's function computed for the plane-layered GIL7 velocity model (Dreger and Romanowicz, 1994) were processed the same as the data. Static deformation Green's functions were computed using the Okada method for a half-space structure. The two data sets were combined and simultaneously inverted for the kinematic rupture process.
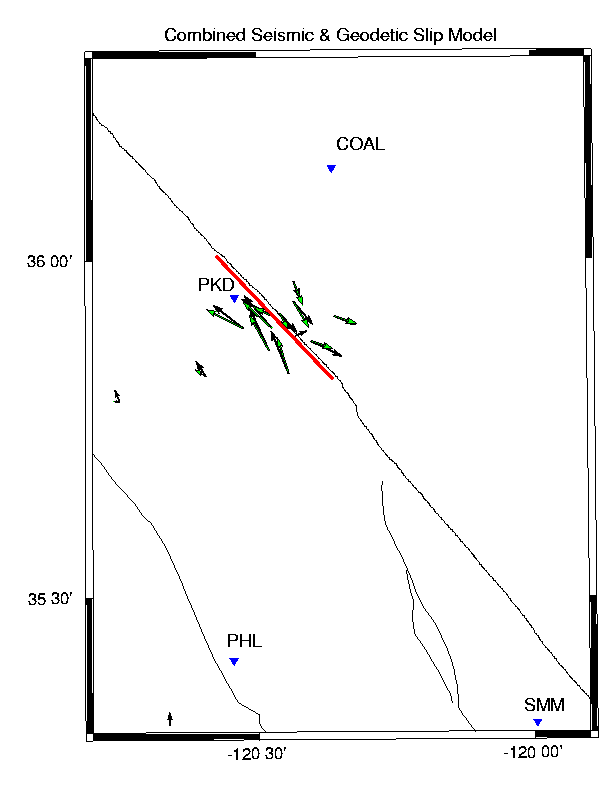
Figure 1 shows the locations of several of the near-fault seismic stations and the observed (black) and predicted (green) GPS vectors. The modeled fault trace is shown as the red line. The fault orientation has a strike and dip of 137 and 80, and was modified slightly from the BSL moment tensor solution. The total length of the modeled fault is 30 km. The epicenter is located 3 km from the southern end of the fault.
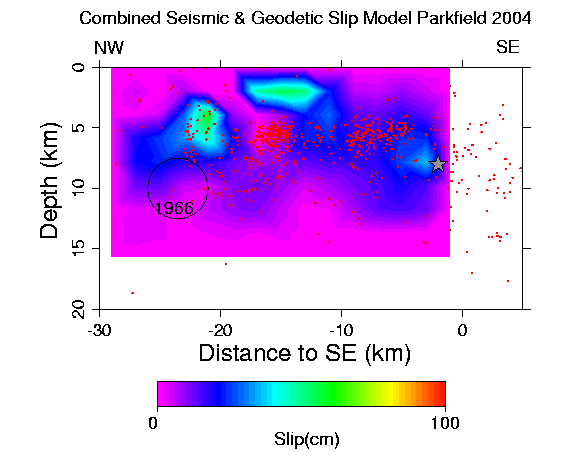
Figure 2 shows the resulting slip distribution assuming a rupture velocity of 2 km/s. At the present time this value seems to best fit the records, though additional data need to be added to be able to fully resolve the rupture velocity of the event. The slip is found to be in three main areas extending about 25 km north of the hypocenter. Peak slip is about 50cm, and the total moment is 1.69e+25, larger than obtained from the moment tensor inversion, corresponding to Mw6.1. One patch extends northwest from the hypocenter approximately 10 km. Between 10 to 18 km there is a shallow patch of slip required by the near-fault GPS data. The third patch of slip lies beneath Middle Mountain in the depth range from 3 to 10 km, above the inferred nucleation zone of the 1966 Parkfield earthquake. The curious "hole" in slip 15 km along = strike and at a depth of 5 km is the location of the 1994 Mw 5 Parkfield earthquake. The details of the slip distribution will undoubtedly change as more data are added, and the full range of model parameters is explored.
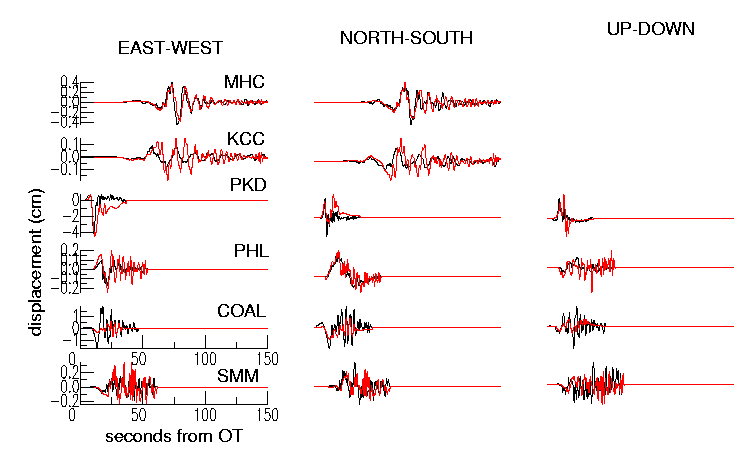
In figure 3 the observed (black) and predicted (red) waveforms are shown. There is a reasonable level of fit to the data, particularly the long-period components.
The slip that occurred in the 2004 Parkfield event is in some ways complementary to the slip that occurred in the 1966 event, in a manner similar as described by Segall and Du (1993). Both the 1934 and 1966 events are thought to have nucleated at depth beneath Middle Mtn and then propagated to the SE. The 2004 event in contrast nucleated SE and ruptured NW to Middle Mtn.
Doug Dreger, Berkeley Seismological Lab