

|
|
|
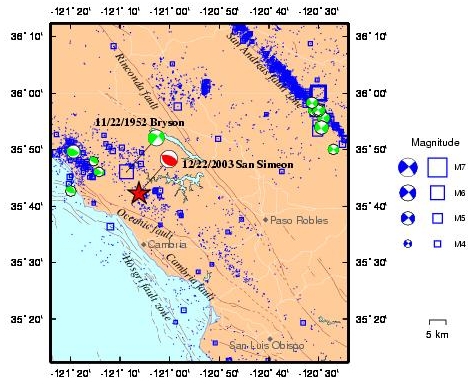
Map showing the background seismicity from 1966-2003 in the
region of the San Simeon earthquake. Earthquakes with magnitude less
than 3 are plotted as points; events with magnitude greater than 3 are
plotted as open squares. Moment tensors solutions for events prior to the
12/22/2003 M6.5 are shown in green, while the location and mechanism
of the event are shown in red.
As this map shows, recent background seismicity in the vicinity of the San Simeon earthquake shows numerous events with reverse mechanisms, including a M4.9 event in 1991, in contrast the dominately strike-slip mechanisms associated with events on the San Andreas fault. The location and first-motion mechanism of the 11/22/1952 M6.0 Bryson earthquake are from Dehlinger and Bolt (1987) and are interesting in the context of the recent event. The location is not well determined, owing to the sparsness of instrumentation at that time. Other sources place it further west, closer to the patch of activity along the coast. According to the UC Berkeley earthquake catalog, the Bryson earthquake had 17 aftershocks over M3.0. |
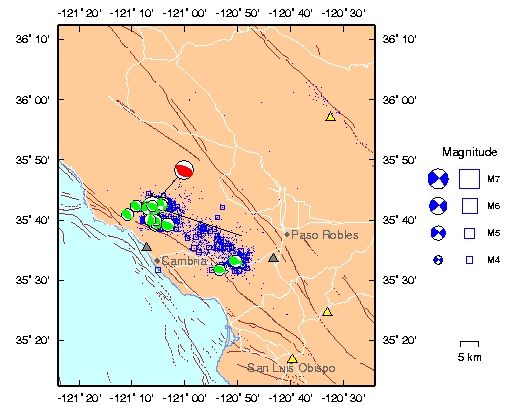
Earthquakes in the region of the San Simeon earthquake
since the 12/22/03 mainshock. The aftershock region extends from the
mainshock to the southeast. The solid line indicates the extent of
the line source determined on the 22nd and used to update the ShakeMap. Triangles
indicate the location of stations used in the ShakeMap - yellow indicates
near real time stations; grey indicates stations without communications that
were not available in near real time.
Numerous aftershocks are being recorded by stations in the CISN. In particular, the Parkfield High Resolution Seismic Network has recorded over 55,000 triggers since December 22nd. Over 130 earthquakes of M3 have been recorded, and 10 events of M4 and higher as of March 8,2004. Most of the larger events have been cluster in the hypocentral region. |